
The financial astrological prediction for the XAU/USD (gold price) can be summarized as follows:
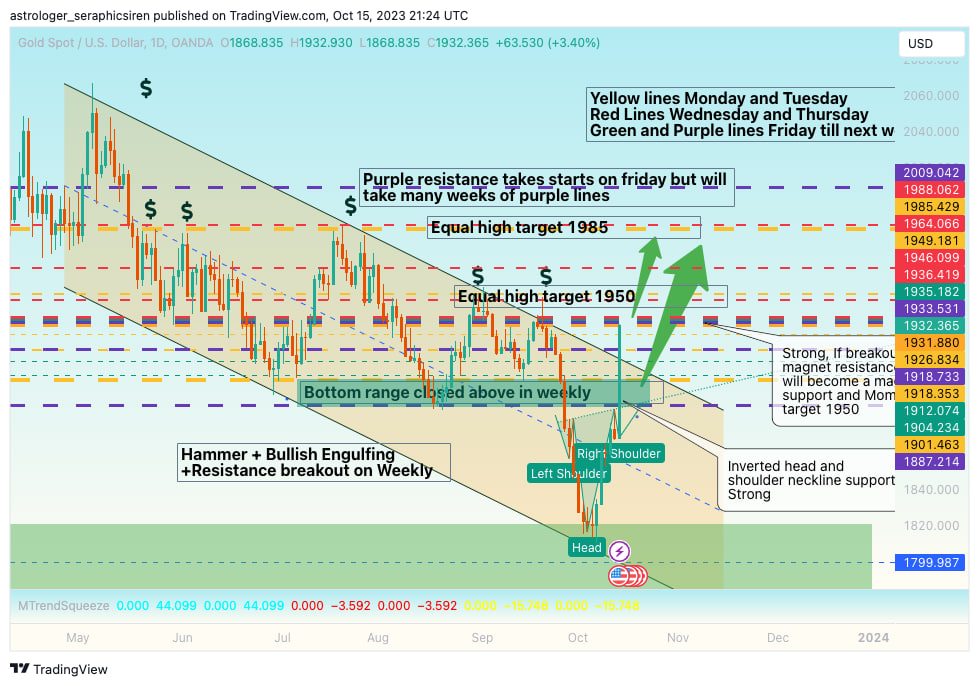
- XAU/USD has experienced a technical bounce from downtrend line support and has broken and closed above the downtrend line resistance, suggesting a shift in market sentiment.
- The current market trend has transitioned from a bearish trend to a more neutral stance.
- In the weekly structure, there is a pinbar and a bullish engulfing pattern, indicating potential bullish sentiment.
- The daily structure suggests the formation of a possible inverted head and shoulder pattern, with the right shoulder in the range of 1985-1930.
Weekly Analysis:
- The week began with two days of bullish energy, signaling a desire to buy on retracement or strong community support. This is represented by yellow lines.
- Following the bullish days, there were two days of sell energy, which may be viewed as a correction.
- By the end of the week, there is the start of purple and green line bullish panic energy, potentially indicating an element of unpredictability and high volatility with a price target of 2009 by near end of the month.
Fundamental Analysis:
- The presence of a new war in Palestine and Israel is mentioned, which could drive gold prices higher due to its status as a safe-haven asset during times of crisis.
- The analysis highlights the potential impact of war-related news on gold prices, with a typical pattern of initial decline, followed by an increase during the news phase, and a pullback after the official announcement of war.
- The analysis also considers the potential impact of rate hikes, rate pauses, and rate cuts on the gold market, with rate hikes seen as bullish, pauses leading to sideways movement, and rate cuts as bearish, prompting profit-taking and potential quantitative easing.
Price Magnets for the Week:
- The analysis identifies strong price magnets around 1933-1912-1904 and emphasizes the importance of monitoring these levels to determine the direction of the market.
Daily Interpretations:
- Daily interpretations provide insight into daily price levels, support, resistance, and potential gap openings due to war-related events.
- The analysis suggests that the market may be testing key levels, and monitoring price movements is crucial for determining the next direction.
Overall, the prediction points to a mixed outlook for gold prices, with both bullish and bearish correction factors at play. It advises caution and the need to observe price confirmation before making any trading decisions.