

The financial astrological prediction for the XAU/USD (gold price) is as follows:
- Technical Analysis:
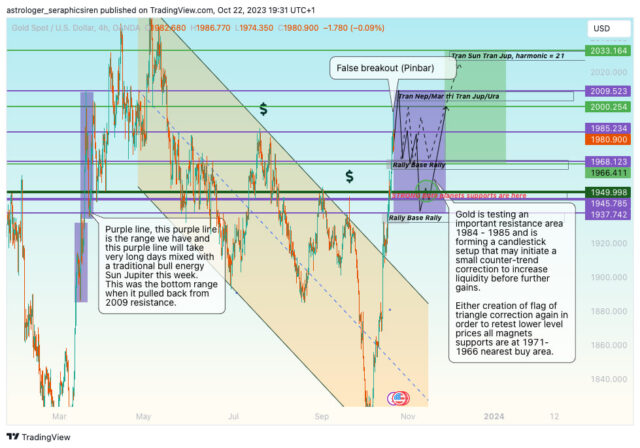
- There has been a technical bounce from downtrend line support, and the market has broken and closed above the downtrend line resistance.
- The current market trend has broken the bearish trend resistance, indicating that the bearish trend is no longer in effect.
- Weekly structure shows a pinbar and a bullish engulfing pattern.
- The daily structure suggests the possibility of an inverted head and shoulders pattern with the right shoulder ranging between 1985 and 1930.
- Weekly Analysis:
- The current week has witnessed five days of bullish panic mixed with solo traditional bull energy. This combination affects traders’ psychology, leading to speculation and optimism in the market with an element of unpredictability and high volatility.
- Strong support zones are identified, such as 1950-1947 and 1968-1966, Horizontal support is 1963, with the latter being the nearest support and an important level to watch for potential pullback corrections while 1954-47 is going to be hard to break this week look for buys near these areas, and price of the target is 2009-2033.
- Fundamental Analysis:
- The prediction takes into account the impact of a new war in Palestine and Israel, which may lead to bullish movements in gold prices, as gold is historically seen as a safe-haven asset during times of conflict.
- There is also uncertainty related to US debts and concerns about slower economic growth, which could drive investors toward gold as a hedge.
- The analysis suggests that the US government may have to print more money or potentially default on bond payments, which could influence the gold market.
- The prediction highlights the potential risks associated with US debt, mentioning that a collapse in the bonds market and significant equity market declines may occur.
- FOMC Blackout Period:
- The upcoming FOMC Blackout period is noted, which can affect the market depending on the Federal Reserve’s actions.
- Planetary Transition Analysis:
- The prediction includes astrological points that indicate bull panic energy, with specific dates and times mentioned.
- Daily Interpretations:
- Daily support and resistance levels are discussed, along with the potential impact of closing prices on the market’s direction.
Overall, the prediction suggests a mixed picture for the gold market, with elements of both optimism and uncertainty. It advises caution and offers potential support and resistance levels for traders to consider.