The financial astrological prediction for the XAU/USD (gold price) can be summarized as follows:
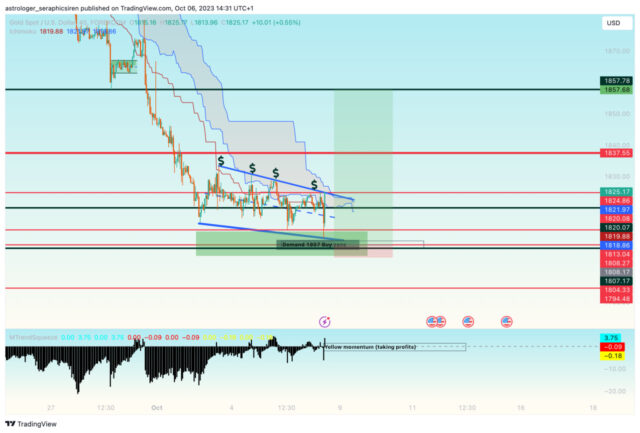
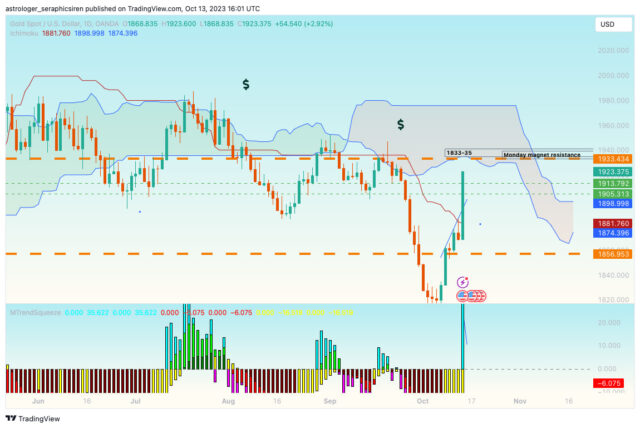
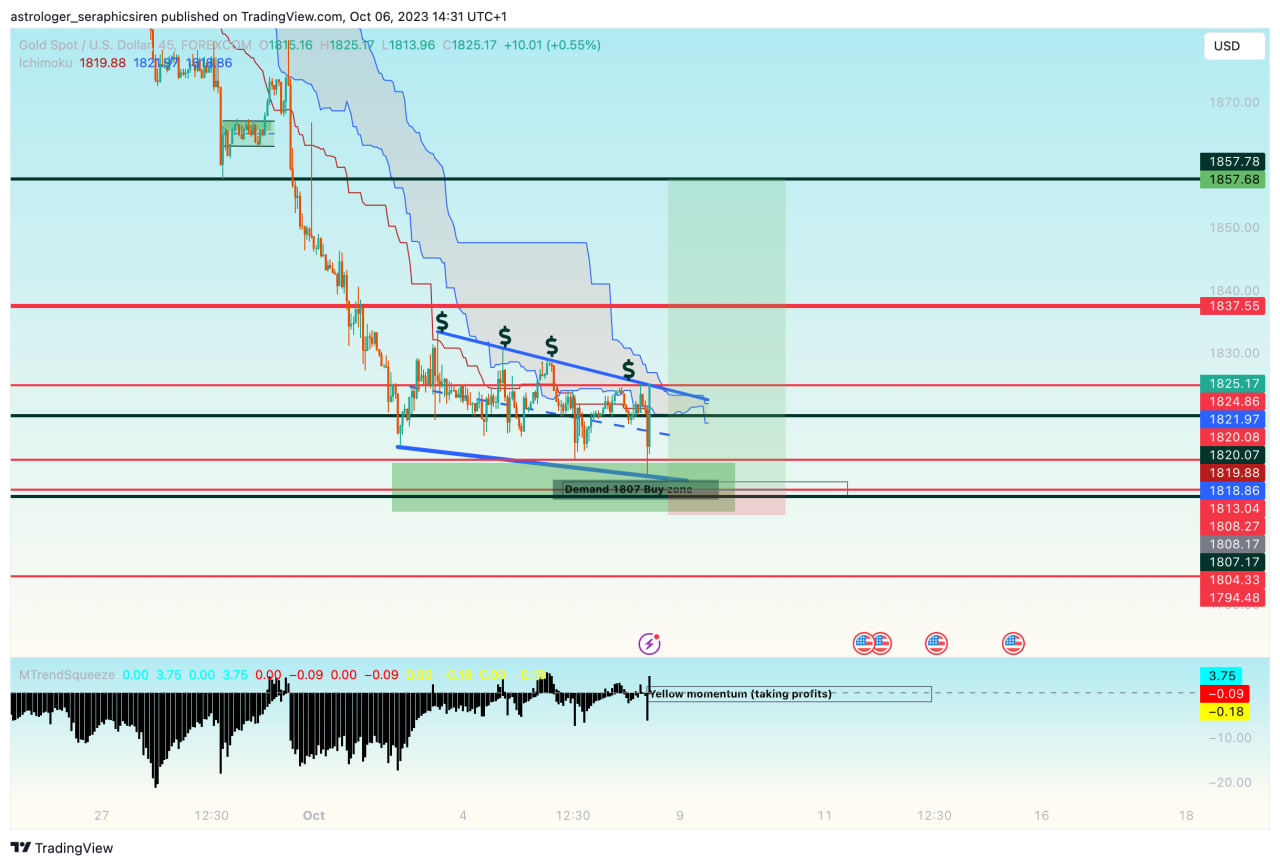
- XAU/USD had been in a triangle squeeze but has finally broken down, indicating a bearish sentiment, But bounced back from bear trendline support 1810.
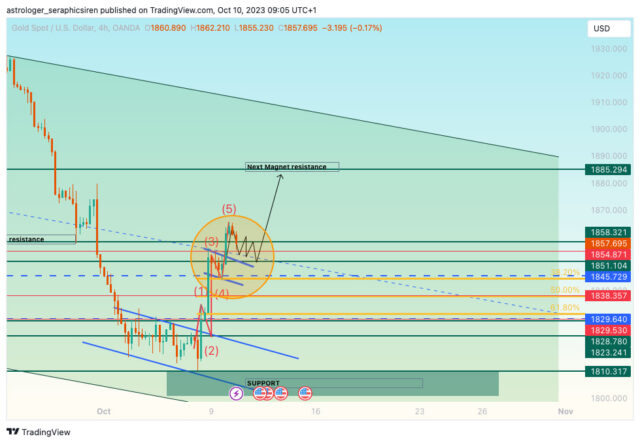
- The probabilities of buy for pullback and clear bull reversal when 1865 level broken.
- The current market trend is bearish, with the weekly structure showing a broken triangle pattern from the level of 1908.4. The daily structure includes a bearish pinbar from 1946, but bull energy is dominant this week.
Weekly Analysis:
- The week is marked by four days of bullish energy and one day of no planetary energy. The bullish energy on a downtrend is seen as a retracement retest of resistance levels.
Fundamental Analysis:
- The presence of a new war in Palestine and Israel is noted as a factor that may affect gold prices. Historically, gold tends to rise during times of conflict. I expect a gap.
- The analysis highlights the potential impact of rate hikes and economic news on gold prices, with the anticipation of a rate hike leading to traders buying on rumors and selling on the actual news result.
- Upcoming economic events, such as PPI, FOMC minutes, and CPI, are mentioned as potential factors that could provide direction to the gold market.
Price Magnets and Daily Interpretations:
- Price magnets and daily interpretations are provided for monitoring key price levels and potential market movements.
- The analysis emphasizes the importance of observing daily price closings, support and resistance levels, and the potential for gaps in the market.
- The presence of specific planetary energies, represented by green and red lines, is considered in the daily interpretations.
Overall, the prediction suggests a cautious approach to gold trading, advising traders to monitor key levels and be prepared for potential market fluctuations based on both technical and astrological factors. The impact of war and economic events on gold prices is also highlighted.

One day of sell energy (pullback) Strong support 1967 while bottom range is 1957

Continuation

Broken 1920 bear trend and Stopped at the Next week’s Monday Resistance 1933