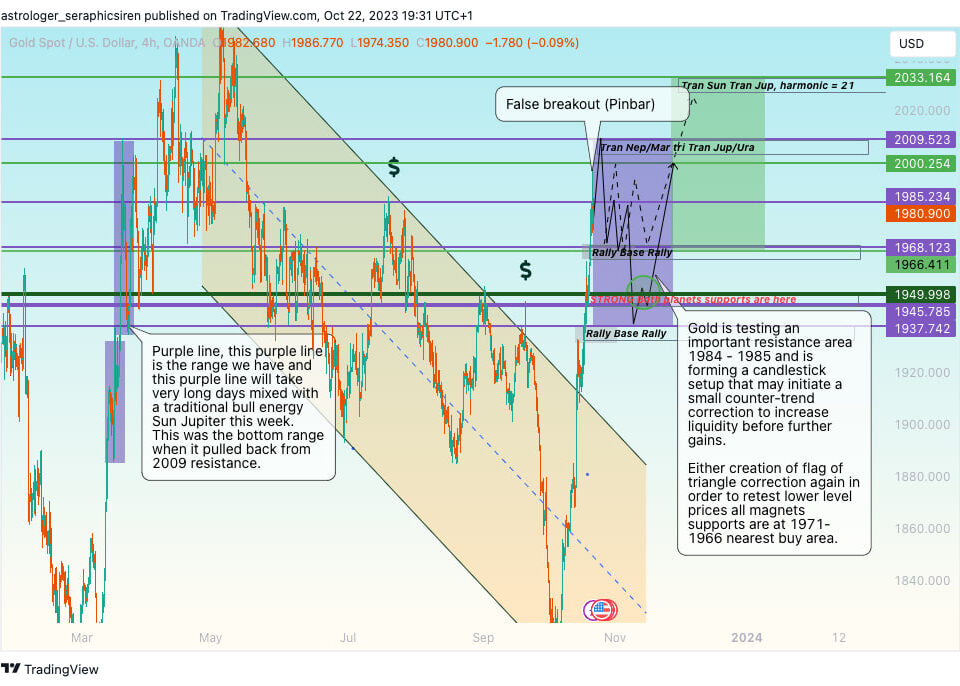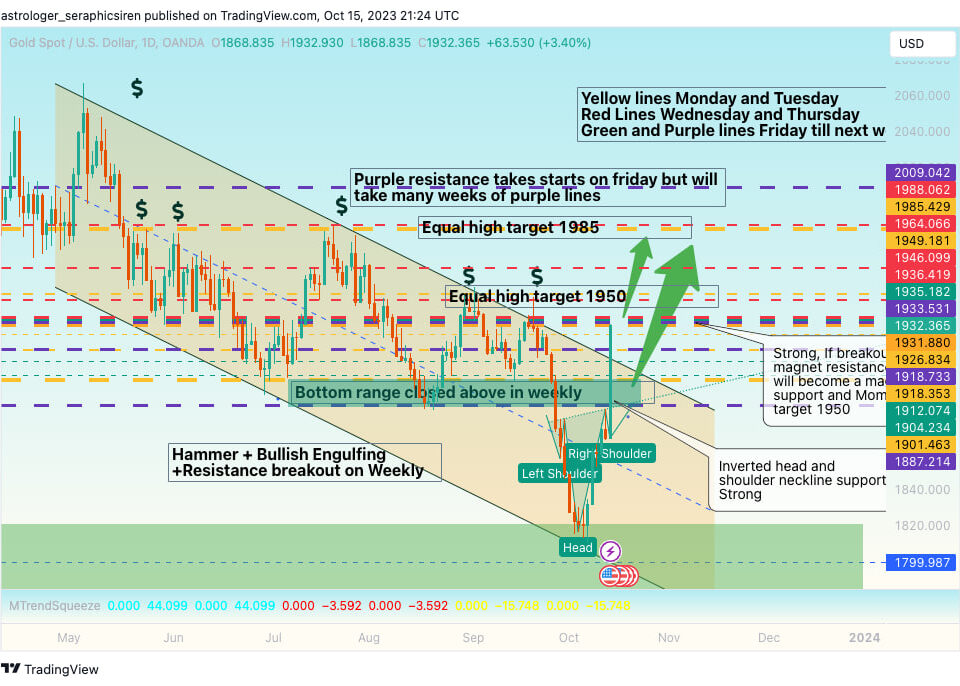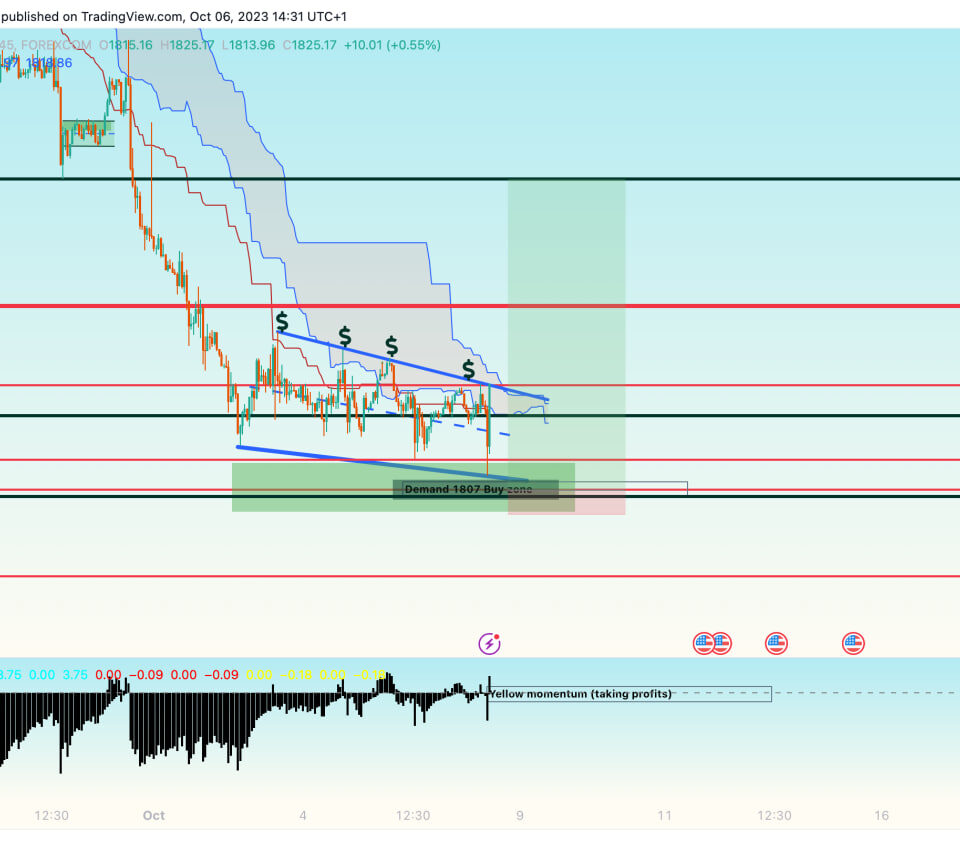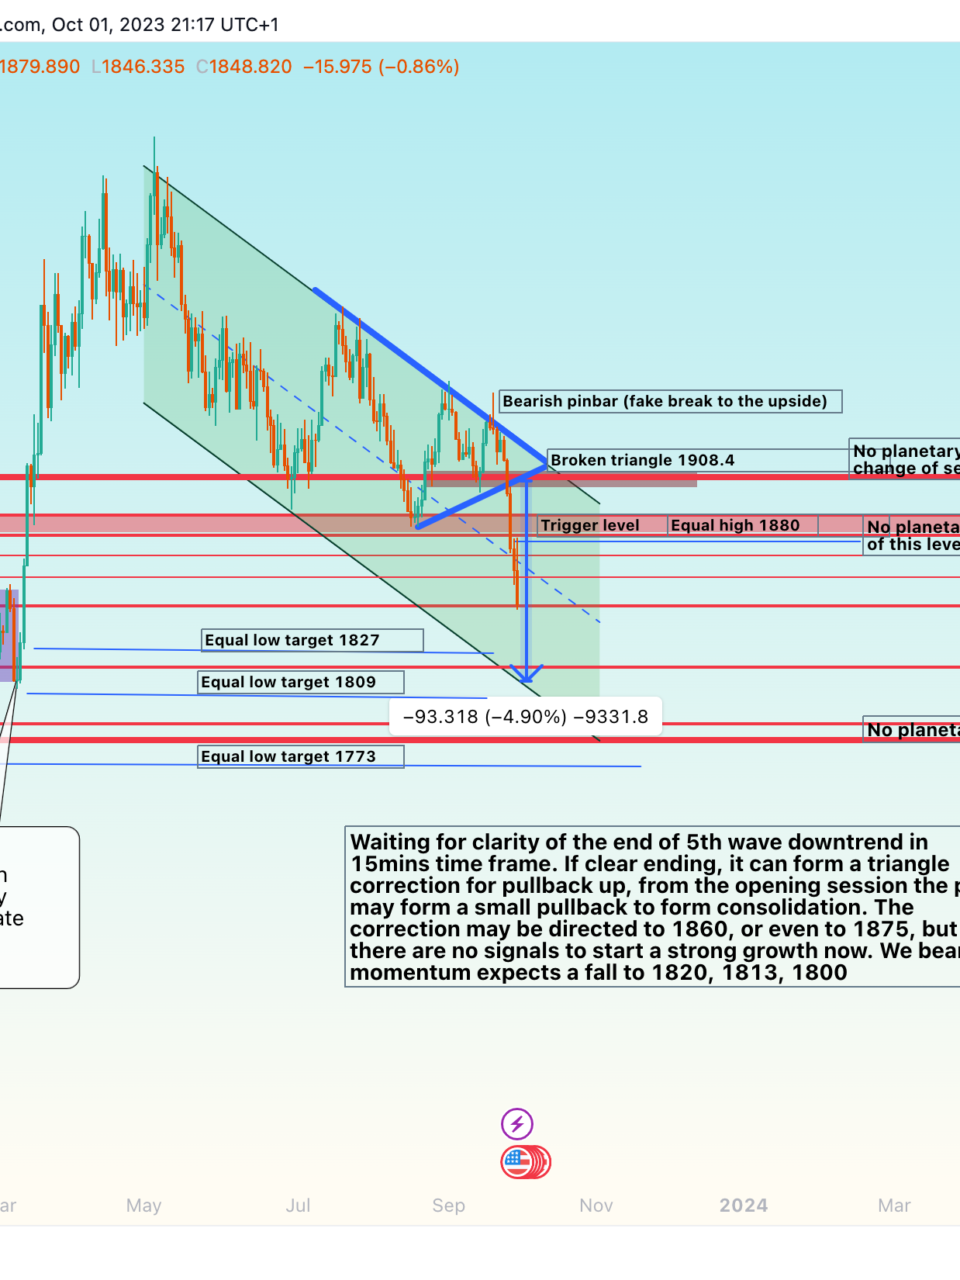
Track Record : Astrological Prediction For Gold Forex May-August 2024
As a financial astrologer, I’ve been closely watching the planetary movement influencing gold prices, and there are some fascinating patterns unfolding that every gold forex trader should be aware of. Here’s what the stars are signaling for the weeks and months ahead.
Bullish Energies in Play: Jupiter-Sun Aspects
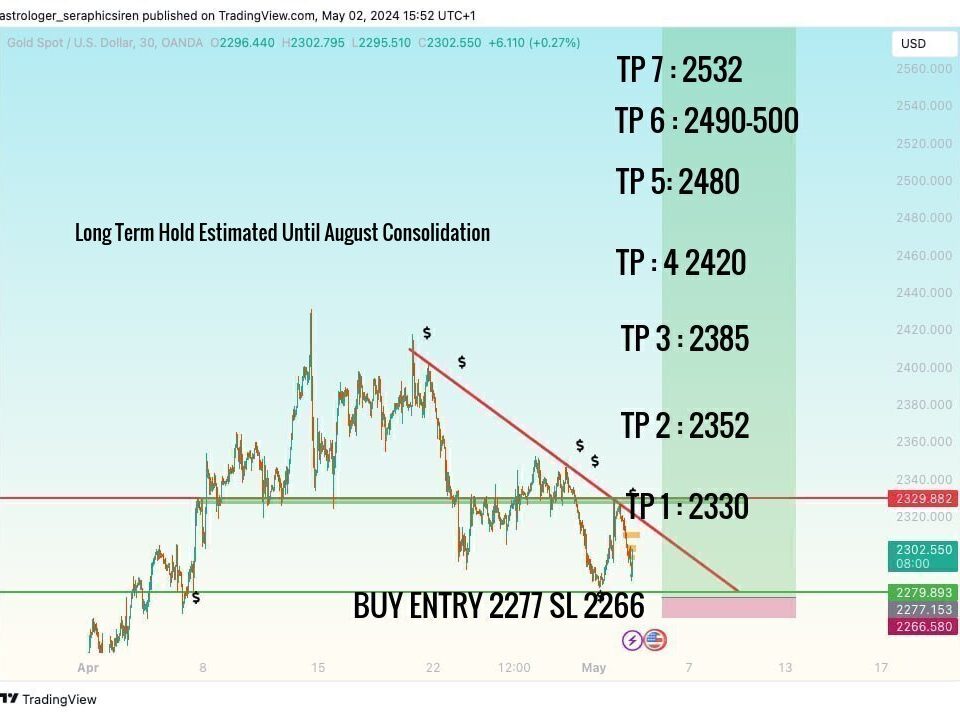
The timing of bullish energies, such as Jupiter-Sun aspects, appearing in the 7th harmonic, are a significant focus in the current market landscape. These aspects are setting up a strong demand zone between the 2390 and 2277 range each week. This harmonic influence supports increased buying pressure, suggesting that traders should be on alert for potential buying opportunities within this range.
Spontaneous Selling Pressure: Uranus-Mars Aspects Creating Supply
However, the spontaneous sell energy stemming from the Uranus-Mars aspects is creating a significant supply barrier near the 2500 mark. This duality in cosmic influence suggests that the gold market is currently caught in a consolidation phase, hovering between these demand and supply zones.
Consolidation Phase Expected Until August 2024
I foresee this consolidation continuing from May 2024 through August 2024. During this period, prices are likely to oscillate within the 2277-2500 range as the market digests these opposing planetary forces. However, my analysis shows a breakout from this consolidation around September 2024. A potent planetary combination indicates a “bullish panic,” which could trigger a sharp upward move, catching many traders off guard.
Elliott Wave Analysis: Corrective Waves in Play
From an Elliott Wave perspective, the high time frame currently points to a corrective wave sequence, particularly waves 3 and 4, forming around the 2390-2277 range. This correction phase aligns perfectly with the anticipated consolidation period. As we approach September, the potential for a bullish breakout becomes stronger, offering a lucrative position trade for those prepared to ride the wave.
Trading Strategy: Long-Term Position
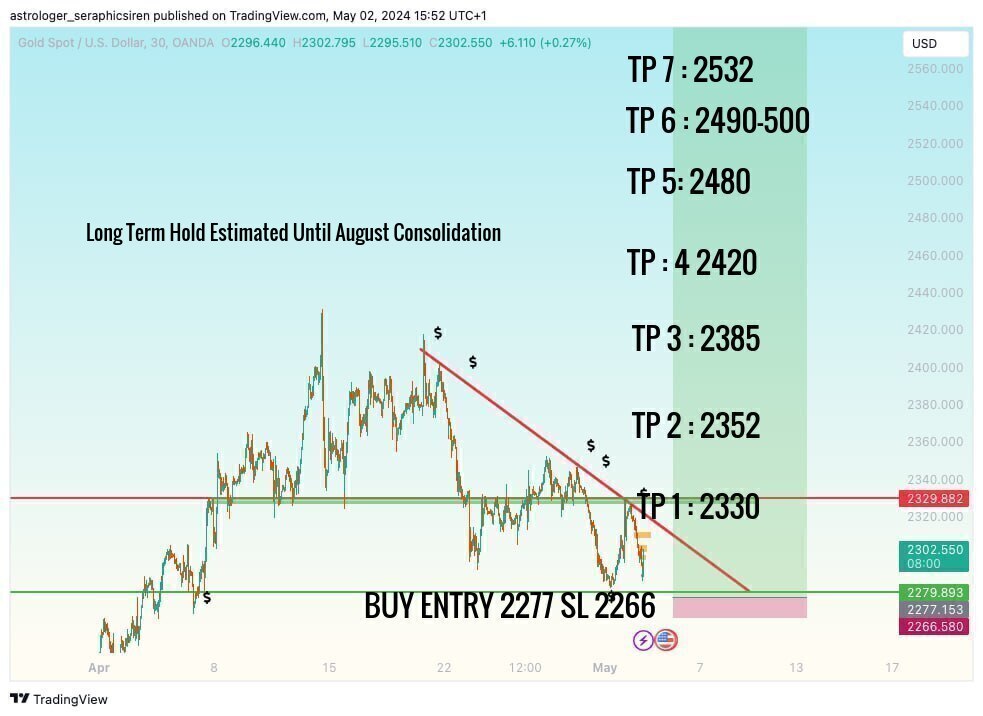
For those looking to position themselves for the long term, my signal is to Buy within the 2390-2277 range, with a Stop Loss at 2266. The take profit levels are detailed in the accompanying chart (see photo). This trade is expected to play out over approximately three months, capturing the anticipated breakout.
Opportunities for Day Traders: Weekly and Daily Signals
If you’re a day trader seeking to navigate these weekly and daily fluctuations, I recommend considering my weekly Gold Astro Forecast Pro product, which includes astrological predictions PDF, fundamental and technical chart analysis, and access to my paid Telegram Group for timely updates of daily signals and scalping signals, or monthly membership service. This service offers detailed insights and trading signals tailored to shorter time frames, allowing you to capitalize on the market’s evolving conditions.
Get Ready for the Breakout in September?
With the current cosmic setup, gold traders should be prepared for a period of consolidation followed by a potentially explosive breakout around September 2024. Whether you’re a long-term position trader or prefer shorter-term trades, there are opportunities to be seized by aligning your strategies with these astrological insights.
Stay tuned to my updates for real-time guidance, and consider joining my membership service to receive exclusive weekly and daily trading signals.


